2020
U.S. Space Industry Employment and U.S. Total Employment Relative to 2010
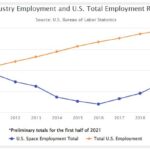
Estimates of the size of the U.S. space workforce are based on statistics made available in the U.S. Bureau of Labor Statistics (BLS) Quarterly Census of Employment and Wages. This program covers 95% of U.S. jobs and provides a consistent and reliable source of information to compare changes in the workforce over time.
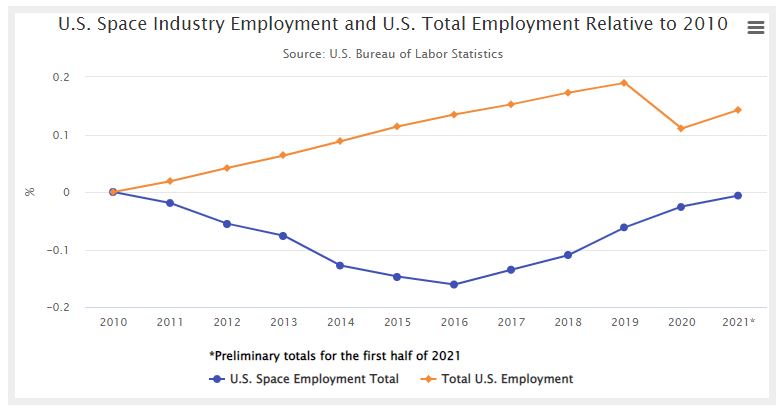
Commercial Infrastructure and Support Industries, 2005-2020
Commercial Infrastructure and Support Industries, 2005-2020 Specifically amounts in Billions of U.S. dollars for commercial satellite manufacturing, and launch industry, as well as ground stations and equipment.
NASA Civil Servant Workforce, 2012-2022
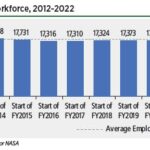
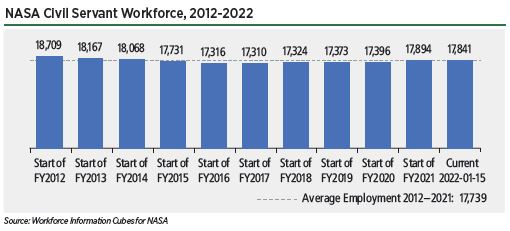
NASA’s civil service workforce has grown gradually in recent years, contributing to an increase in U.S. space employment.
U.S. Space Industry Core Employment, 2011-2021
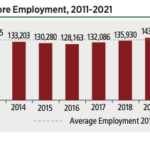
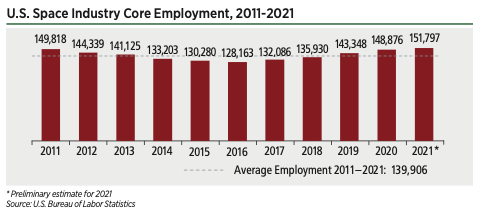
Core employment in 5 key space sectors continued to grow in 2021. These employment levels do not reflect all employment in the U.S. space industry, but rather, track employment in key sectors most closely associated with U.S. space employment.
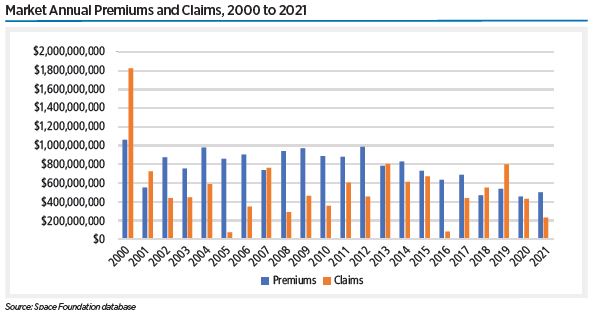
Market Annual Premiums and Claims, 2000 to 2021
KARI Annual Expenditure (millions USD), 2010-2020
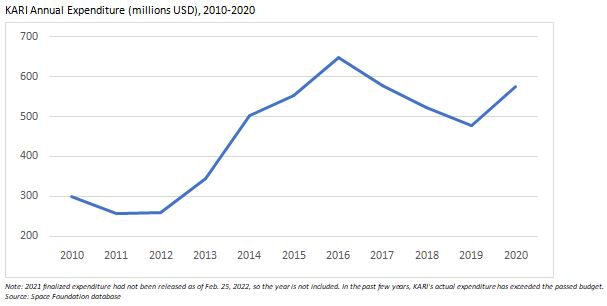
South Korea is intent on building its space program, as this look at its national space agency budget reflects.
Global Launch Attempts by Mission Sector, 2014-2021
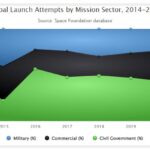
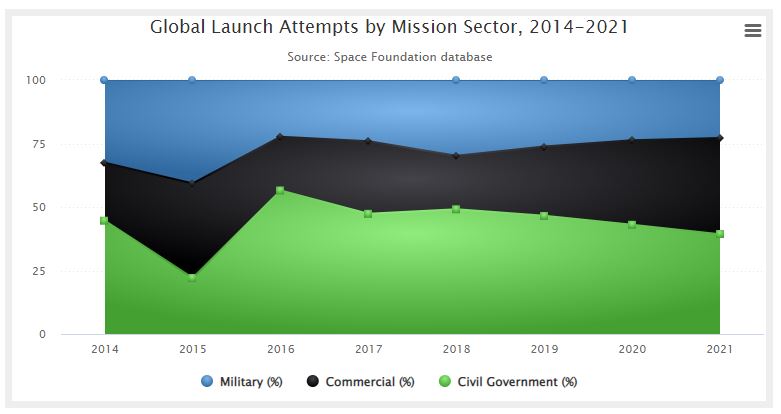
Over the course of seven years, launches for commercial missions have grown while, globally, military and civil missions have taken smaller portions of total launches.
Total Orbital Launch Attempts by China and U.S., 2012-2021
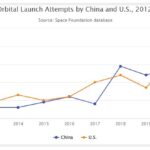
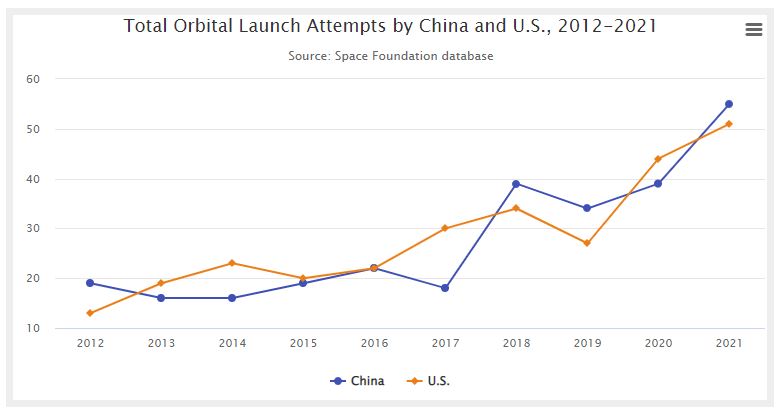
From 2012 to 2021, as China’s space program has matured, it has traded dominance with the United States on annual orbital launch attempts.
Successful Orbital Launches, 1957-2021
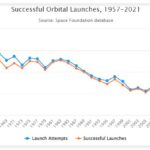
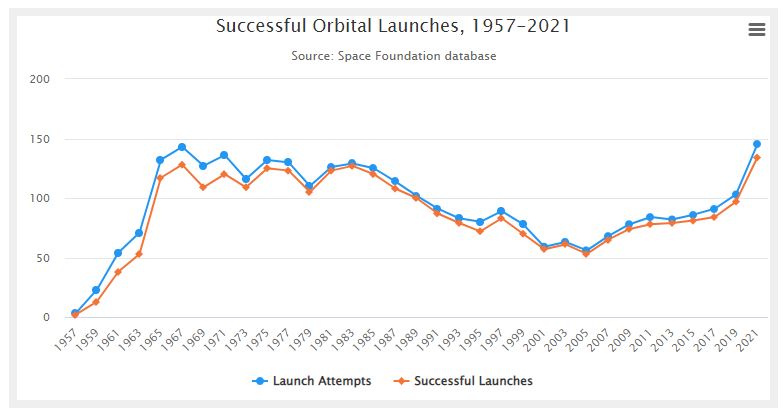
From the days of Sputnik to SpaceX, this chart tracks launch attempts and successful launches.
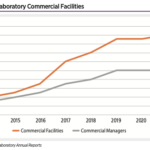
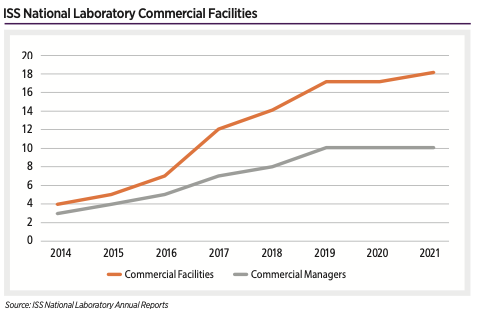
ISS National Laboratory Commercial Facilities
This fully interactive chart shows changes made in the accompanying table. Use the tools just above the table for sorting, advanced filtering, and other options, which will then be reflected on the live chart. For more data source information click to read the entire resource.