Interactive Tables and Charts
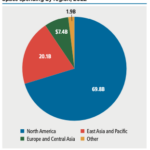
U.S. spaceports hosting successful orbital launches, 2014-2023
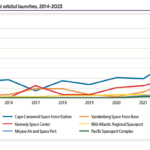
Launch services conducted 83 launches from Vandenberg and 72 from Kennedy, while Virginia’s Mid-Atlantic Regional Spaceport (MARS) at Wallops Island performed 19 launches.
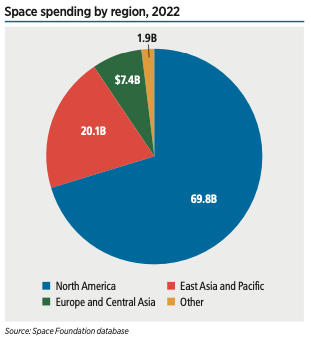
Space spending by region, 2022
 This interactive chart shows changes made in the accompanying table. Use the tools just above the table for sorting, advanced filtering, and other options, these actions will reflect on the…
 Cape Canaveral customer mission share 2014–2023
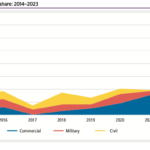
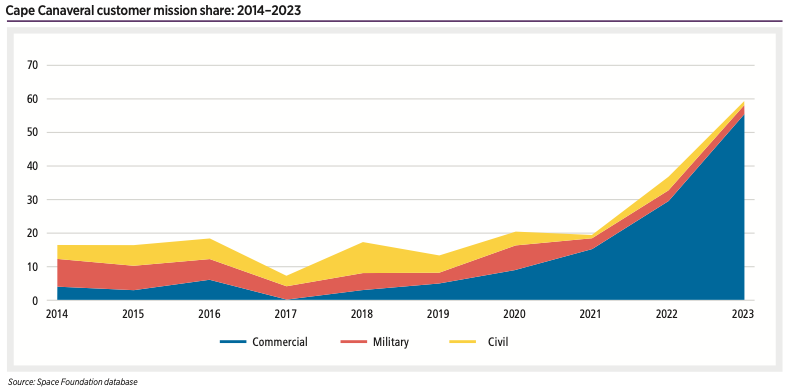
Launches from Cape Canaveral were military-focused for the first few years, with civil missions not far behind.
Satellites lost by launch operator country and type, 2003-2023
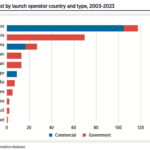
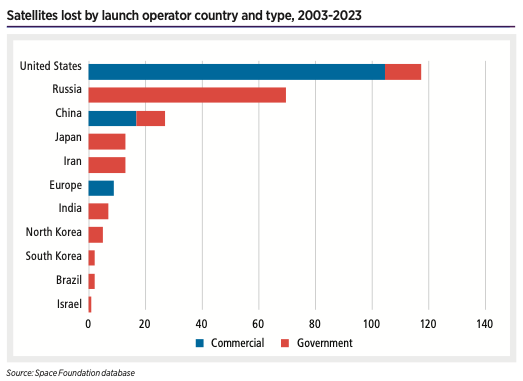
Despite the rising number of lost payloads, satellite operators are getting better at mitigating the harm done to their mission by a launch failure.
Launch service launches from Cape Canaveral and Vandenberg 2014-2023
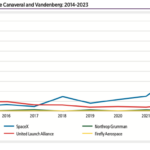
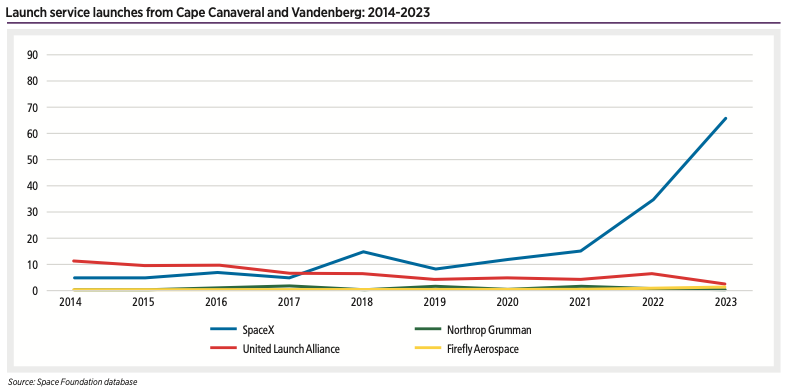
Launches from the Cape and Vandenberg have increased primarily due to one launch service provider: SpaceX.
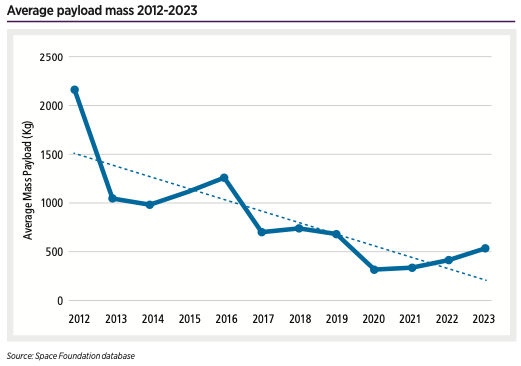
Average payload mass 2012-2023
January, February launches by nation, 2024
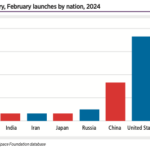
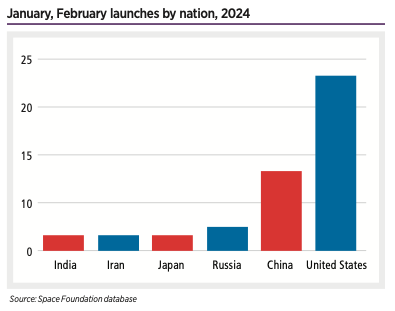
January, February launches in 2024 put the planet in line for the busiest year in space, averaging a launch to space every 32 hours.
S-Network Space Index vs. Benchmark Indexes, 2023
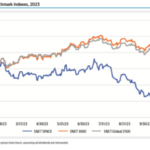
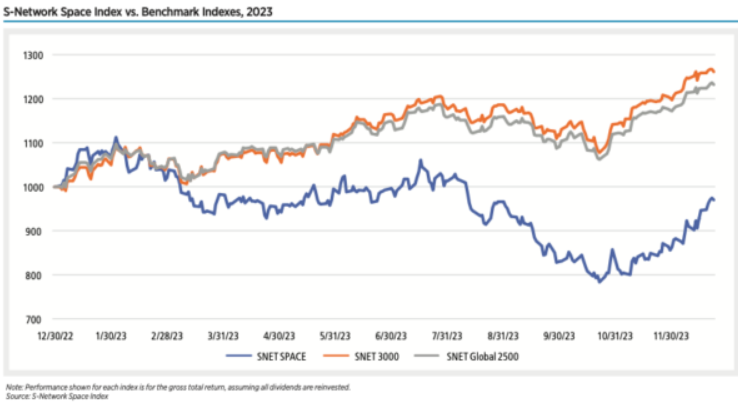
The space industry is a global one, and the composition of the S-Network Space Index reflects this diversity. Companies listed on U.S. exchanges tend to dominate due to the larger number of companies that meet the financial requirements for inclusion in the index.
S-Network Space Index vs. Benchmark Indexes, H2 2023
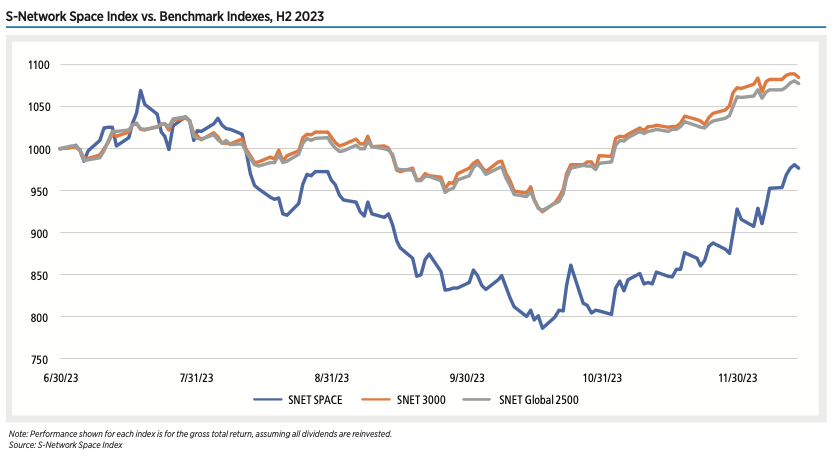
The majority of SNET SPACE’s underperformance was driven by a steep decline of 12.4% in Q3, compared with declines of just over 3% for the other two indexes. In Q4, even though SNET SPACE gained 11.5% and slightly outperformed the SNET Global 2500, this was only sufficient to bring SPACE close to breaking even for the year.
Japanese Government Space Spending, 2013-2023
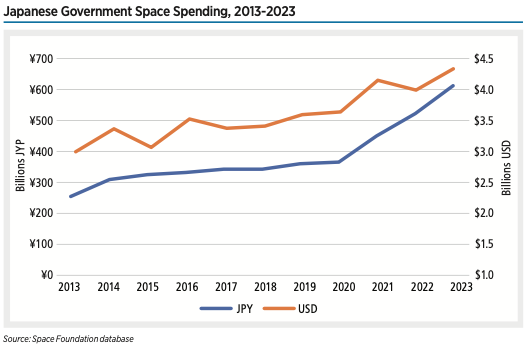
Japan’s space spending spans seven ministries and totaled ¥612 billion (UD$4.3 billion) in 2023. This budget has grown 68% since 2020 as the nation expands its civil and military space programs. The Ministry of Education, Culture, Sports, Science, and Technology (MEXT) — which houses JAXA — typically receives the majority of space-related funding.