Interactive Tables and Charts
Data Economy
European Space Agency Budget, 2005-2021
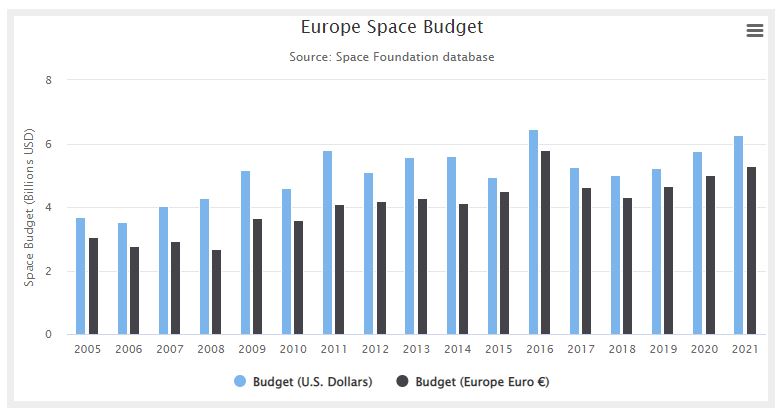
A growing share of European public investment in civil space programs is funded by the European Union under the auspices of its executive body, the European Commission (EC).
Chinese Space Budget, 2005-2021
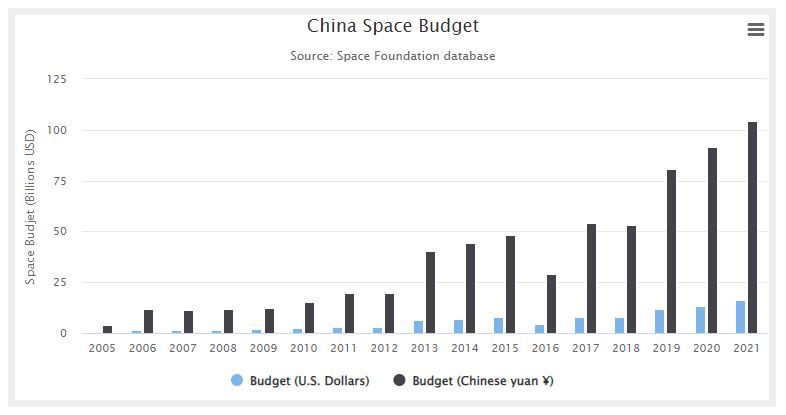
The Chinese space budget is not publicly available. However, Chinese capabilities and space projects provide indicators for informed estimates of the nation’s space budget. . .
Canadian Space Budget, 2005-2021
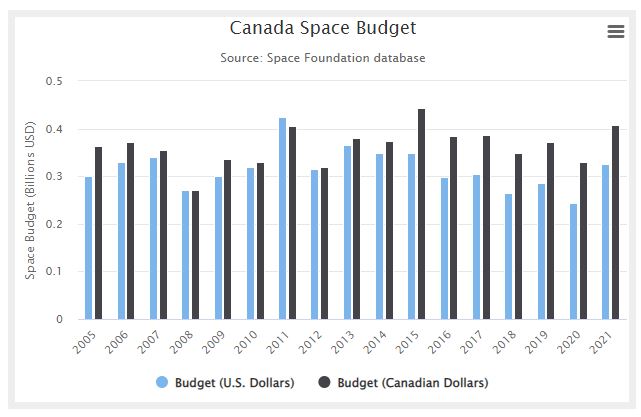
The Canadian government allocates money to the Canadian Space Agency (CSA). Canada is also a cooperating state with the European Space Agency (ESA).
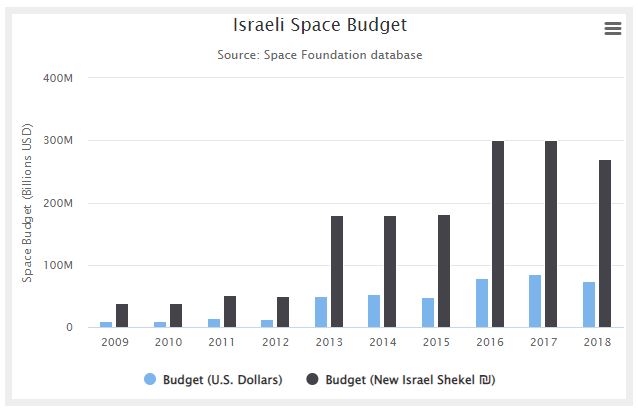
Israeli Space Budget, 2009-2018
 This interactive chart shows changes made in the accompanying table. Use the tools just above the table for sorting, advanced filtering, and other options, these actions will reflect on the…
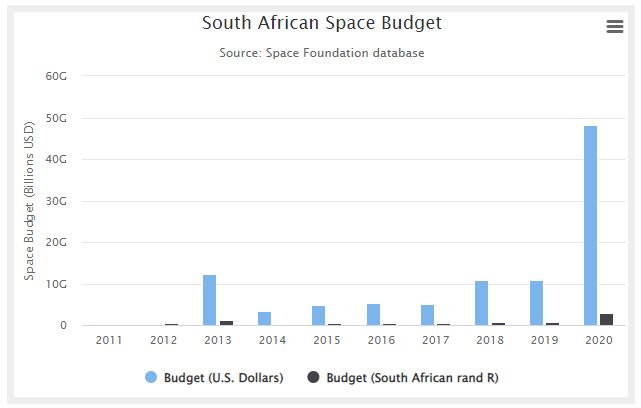
 South African Space Budget, 2011-2020
 This interactive chart shows changes made in the accompanying table. Use the tools just above the table for sorting, advanced filtering, and other options, these actions will reflect on the…
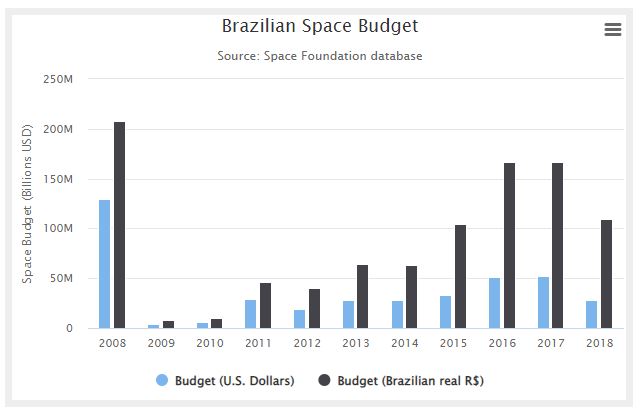
 Brazilian Space Budget, 2008-2018
 This interactive chart shows changes made in the accompanying table. Use the tools just above the table for sorting, advanced filtering, and other options, these actions will reflect on the…
 EUMETSAT Space Budget, 2009-2021
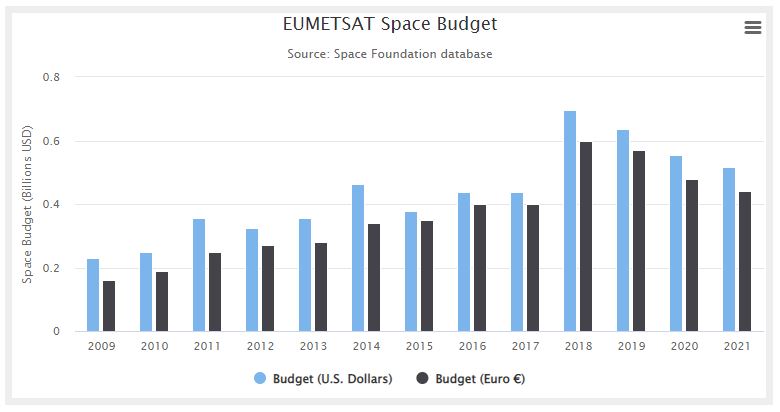
Civil government spending on space programs and activities in Europe comes from four sources . . .
NASA Budget, 1959-2021
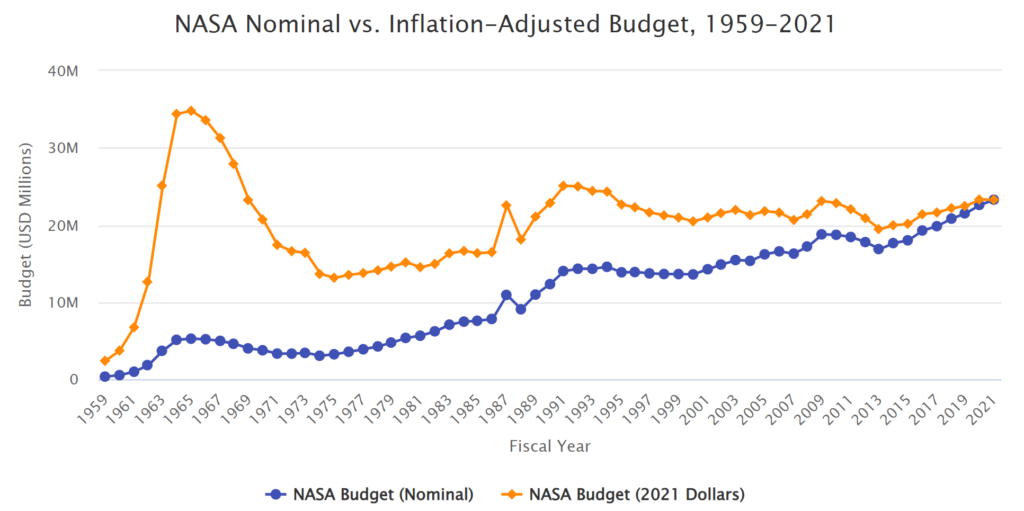
NASA has passed a series of large budget increases over the past few years. However, adjusting for inflation shows that U.S. civil space spending is still below earlier peaks in program history.
Pentagon space spending has more than doubled since 2005
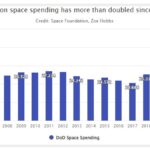
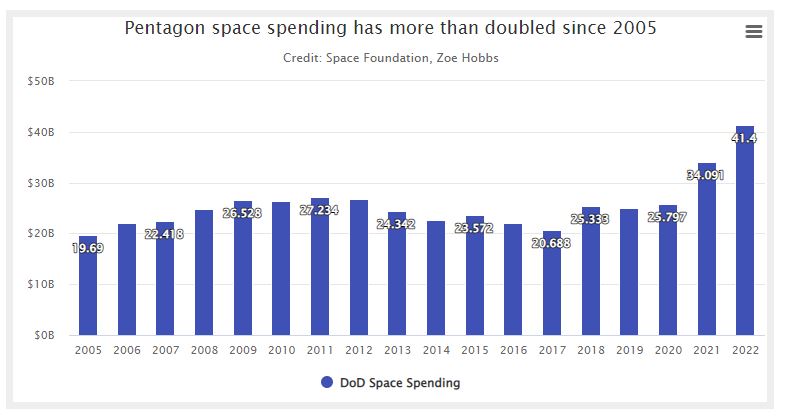
Space Foundation records show Pentagon space spending has more than doubled since 2005 from $19.7 billion to $41.4 billion
Military space spending at four-year intervals
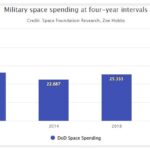
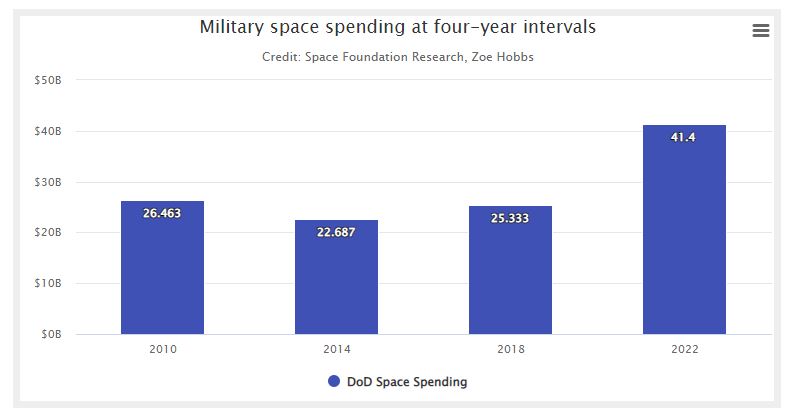
Chart shows military space spending at four-year intervals during President Barack Obama’s two terms, President Donald Trump’s term, and President Joe Biden’s current term.