Interactive Tables and Charts
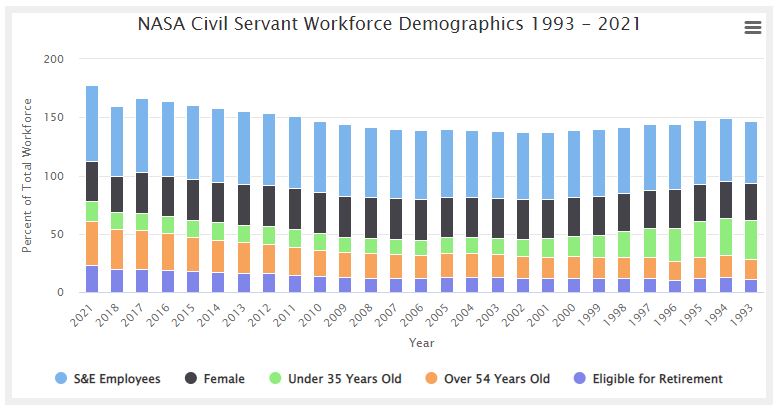
Data Workforce
Space Workforce Trends in the United States, Europe, Japan, and India, 2011-2021
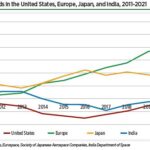
The U.S. space sector is composed of more than 198,500 individuals across private sector and government organizations. Private sector space employment continued a trend of growth that began in 2016, adding approximately 3,000 new workers from 2020 to 2021 to reach 151,797 individuals. Space manufacturing led this growth, offsetting a slight decrease in the size of the satellite telecommunications workforce.
Indian Department of Space Employment, 2011-2021
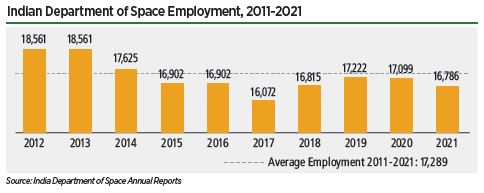
India’s Department of Space had 16,786 employees as of October 2021, a decrease of 1.8% from the previous year. India’s Department of Space had 16,786 employees as of October 2021, a decrease of 1.8% from the previous year. About 75% of the workforce is composed of science and technology workers, while the remainder focus on administration.
JAXA Workforce, 2012-2022
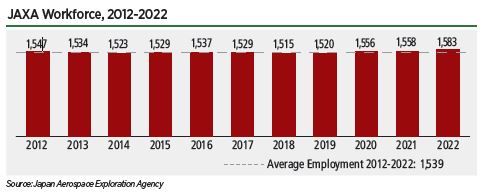
The Japan Aerospace Exploration Agency (JAXA) employed 1,583 people at the end of 2021, an increase of 1.6% from 1,558 employees at the end of 2020. Approximately 70% of JAXA employees work in engineering and research, with the remainder focused on education and administration. JAXA does not face the same demographic challenges as some other space agencies: 22.0% of its workforce is under 35 years old and 17.9% is over 54.
Japanese Space Industry Employment, 2010-2020
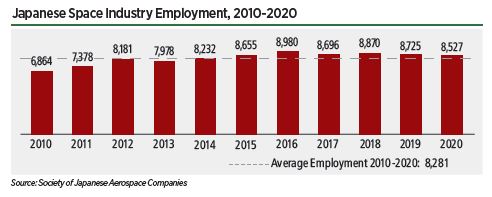
The Society of Japanese Aerospace Companies reports that the Japanese space sector employed 8,527 individuals in 2020, the most recent year for which data is available. This is a 2.3% decrease from the 2019 total of 8,725 employees. More than 70% of these employees work in the space vehicles sector, which includes launch vehicles, satellites, and the international space station. The remaining employees work on ground facilities and software relevant to space. Slight decreases in employment occurred across all portions of the space sector.
European Space Industry Employment, 2011-2021
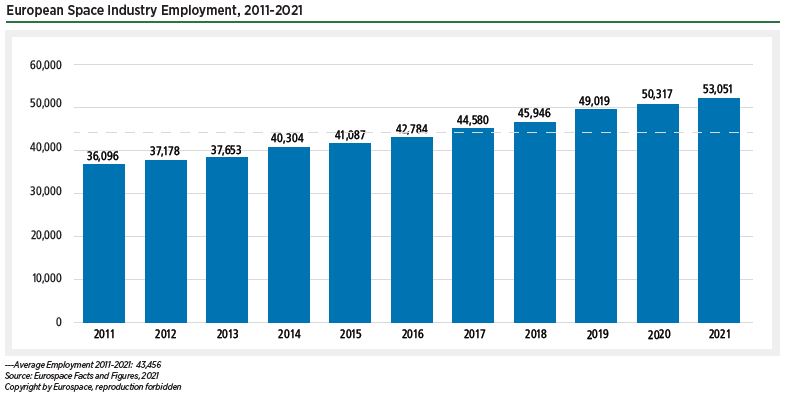
European space employment was 53,051 in 2021, an increase of 5.4% from the total of 50,317 from 2020. This estimate is based on analysis by Eurospace, the trade association of the European Space Industry. The analysis focuses on the space manufacturing industry; space services companies such as Ariane- space, SES, Eutelsat, and Inmarsat which also employ thousands of individuals, are not included.
Change in U.S. Private Employment, Aug. 2021-Aug. 2022
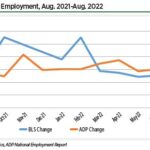
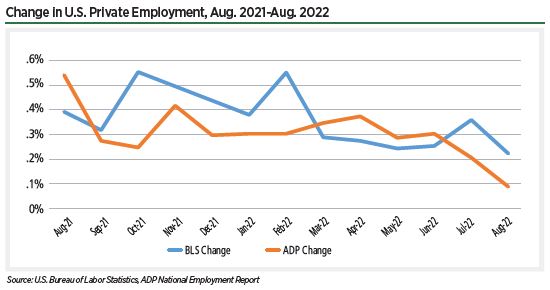
Unlike the BLS data, ADP’s employment data for July grew at a sluggish rate of 0.2%, and both BLS and ADP data for August jobs grew much less than the rest of the year. The BLS’s 0.2% growth was its lowest since April 2021. ADP’s 0.1% growth was the lowest since January 2021, when it measured a 0.1% decrease in employment.
U.S. Space Industry Salaries and Real Salary Growth by Sector, 2015-2020

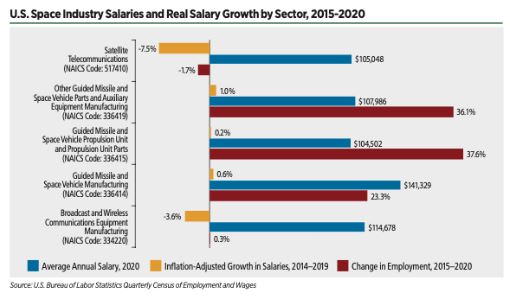
Space sector categories associated with space vehicle manufacturing all experienced growth in real wages from 2015 to 2020. Combined with increased hiring, this suggests that there is a high demand for individuals in these positions.
European Space Industry Workforce by Sector 2003 – 2020
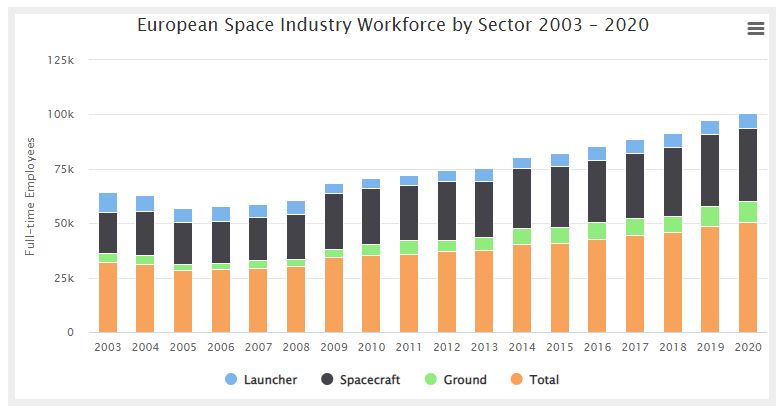
European space industry workforce by sector; launchers, spacecraft, and ground for 2003 through 2020.
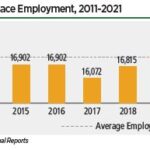
U.S. Space Industry Employment and U.S. Total Employment Relative to 2010
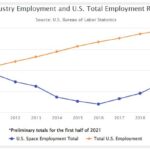
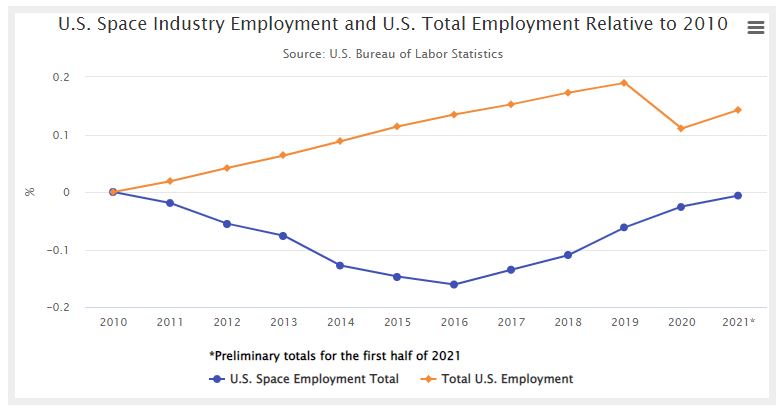
Estimates of the size of the U.S. space workforce are based on statistics made available in the U.S. Bureau of Labor Statistics (BLS) Quarterly Census of Employment and Wages. This program covers 95% of U.S. jobs and provides a consistent and reliable source of information to compare changes in the workforce over time.