Interactive Tables and Charts
Data Economy
Civil Space Spending in Africa (USD), 2021
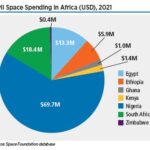
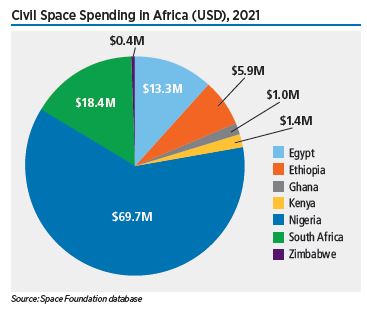
Although the continent’s total space spending is a small fraction of global spending, Africa is quickly becoming a space powerhouse. The African Union’s Agenda 2063 includes the Africa Outer Space Strategy as one of 15 flagship projects “to [accelerate] Africa’s economic growth and development.”
Non-NASA U.S. Civil Space Spending by Agency, 2020-2022
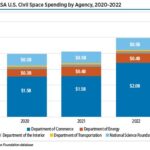
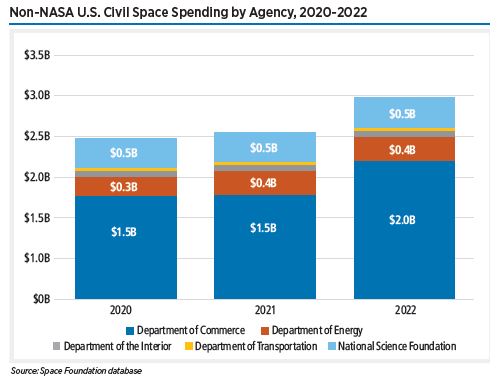
Civil government spending in the U.S. increased 3%. The Department of the Interior’s space budget was held flat in 2021, while the Department of Commerce and the National Science Foundation only increased spending by 1% and 0.3%, respectively. The Department of Transportation, which has the smallest share of U.S. civil space spending, had its budget slashed by 21% in 2021.
Civil Space Spending in Latin America, 2021
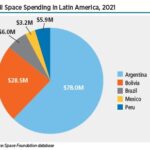
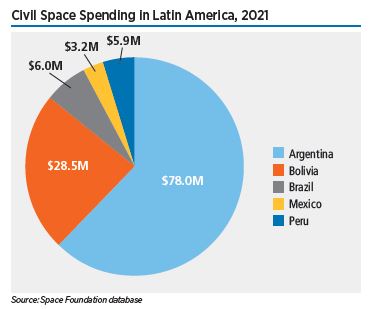
Space spending for the five Latin American countries included in Space Foundation analysis grew 23% to $121 million. Out of the five nations, two saw large budget increases while the other three reduced spending in their respective currencies.
Global Space Activity by Category, 2005-2021
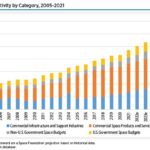
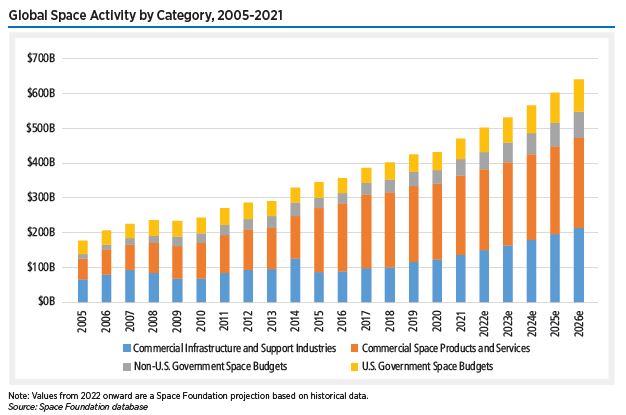
For this year’s analysis, Space Foundation incorporated historical data and 2022 government spending to project the global space economy’s growth over the next five years. Using our methodology, we predict that the total could reach $639 billion by 2026. Our modeling takes a more conservative approach based on average growth of established sectors and does not factor in developing sectors such as lunar habitation or still exploratory concepts such as asteroid mining.
Projected Global Space Activity by Category, 2026
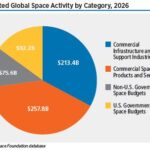
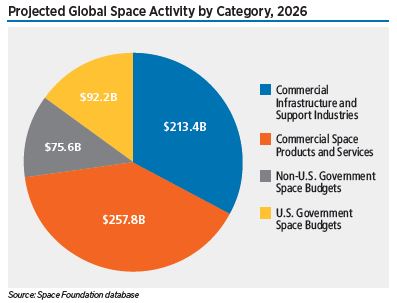
While LEO remains an integral part of the global space economy, interest in cislunar and deep space exploration is growing. Japan, Russia, and the United Arab Emirates (UAE) all have plans to launch lunar landers in 2022, while India’s lunar mission will likely launch in 2023. Many space agencies have set their sights on returning humans to the Moon.
Global Space Activity by Category, 2021
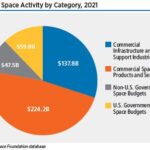
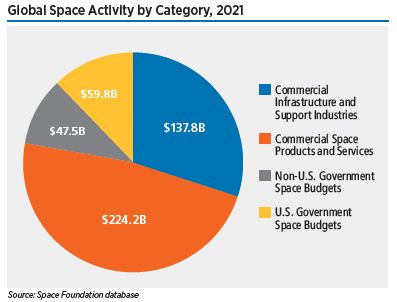
Commercial revenues continued to make up a majority – 77% – of the space economy. This proportion has declined from a previous five-year average of 79%. Commercial infrastructure and support industries remained the smaller of the two subcategories but widened its share of commercial revenues from 35% in 2019 to 38% in 2021.
Index Weight by Listing Country as of June 17, 2022
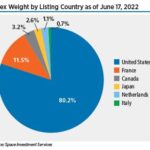
As of June, U.S.-listed companies comprised 80.2% of the weight of the overall index, with France in second place at 11.4%, Japan at 3.2%, Canada at 2.3%, the Netherlands at 2.1%, and Italy at 0.7%. Germany was no longer represented due to the removal of Mynaric.
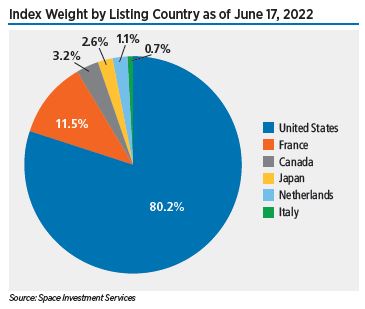
S-Network Space Index vs. Benchmark Indexes, 1H, 2022
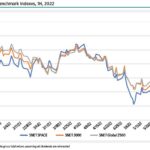
In the first half of 2022, the S-Network Space Index (SNET SPACE) underperformed other benchmark indexes, declining 25.6%. This compares to a 21.7% decrease for the S-Network U.S. Equity 3000 Index (SNET 3000), which tracks the 3,000 largest (by market capitalization) U.S. stocks. Similarly, there was a 20.8% decrease for the S-Network Global 2500 Index (SNET Global 2500), which tracks a combination of the 1,000 largest U.S. stocks, 500 largest European stocks, 500 largest Pacific basin stocks (developed), and the 500 largest liquid Emerging Market stocks.
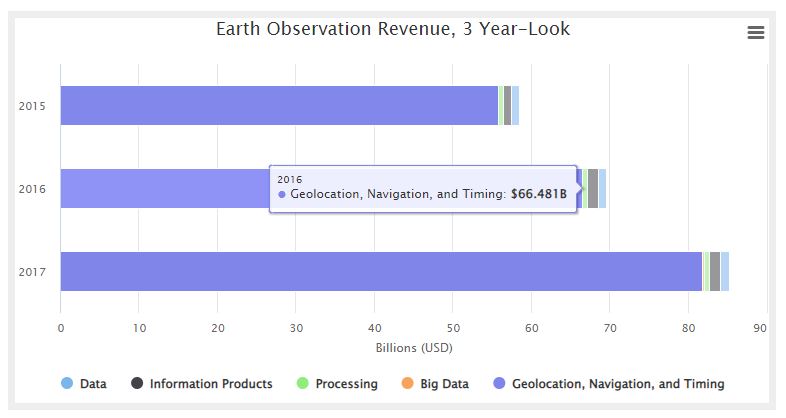
Earth Observation Revenue, 3 Year-Look
Global Economy 15-year Look at Growth
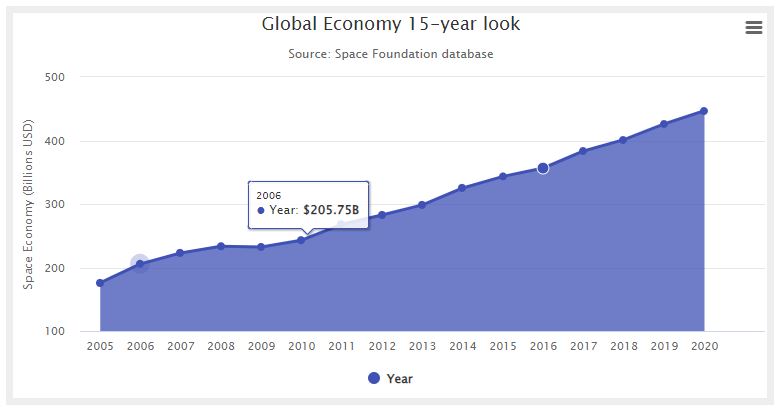
The growth of the global space economy over the past 15 years has come from increasing government budgets and expansion of commercial sectors such as ground stations, spacecraft deployment, increased launch activity and a vastly expanding number of space products and services.