Appendix
Launch Services Value by Market, 2018-2022
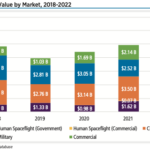
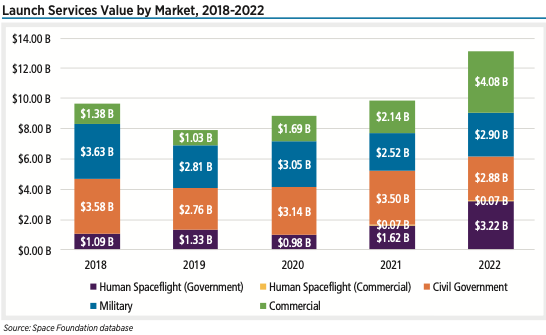
There were 186 launch attempts in 2022, up 28% from 145 attempts in 2021. Of these launches, 179 were successful. Commercial launches, defined as launches carried out for a non-government customer, accounted for 81 of the attempts and 79 of the successes in 2022. This is a significant increase from the 55 commercial launch attempts in 2021.1 The total market value of launches in 2022 was $13.2 billion, based on analysis by Eurospace, the trade association of the European Space Industry.
Global Space Activity by Category, 2007-2027
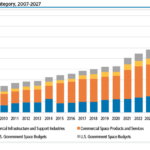
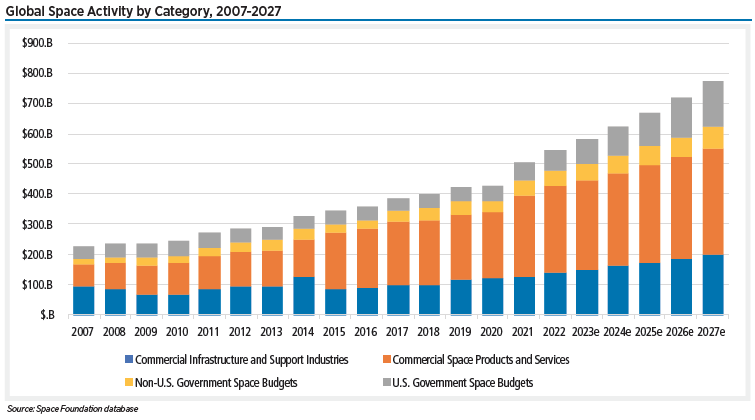
Based on global economic factors, Space Foundation forecasts that growth will slow slightly in 2023 to 6% before picking up for an average five-year growth of 7%. Under these conditions, the space economy would total $772 billion in 2027. This forecast incorporates existing markets in the space economy and does not predict any future disruptive technologies that could have extraordinary growth over the coming years.
Governments that Increased vs. Decreased Space Spending, 2018-2023
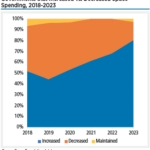
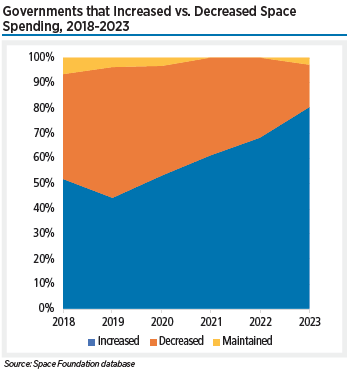
Governments are continuing to grow their space programs at a rapid pace in 2023, preliminary data for 36 nations show. The proportion of nations that increased spending in 2023 reached 81% compared to 68% last year and 52% five years ago.
Foreign-Born Individuals in S&E Occupations in The United States, By Level Of Degree and Occupation: 2017
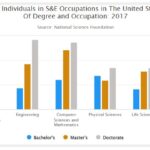
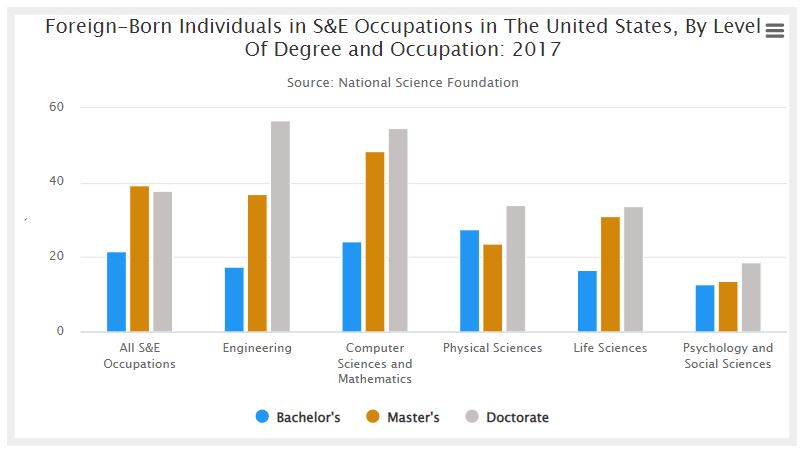
Although recent data isn’t available, if China keeps up the pace of graduating students with science and engineering degrees, its numbers will swamp the United States.
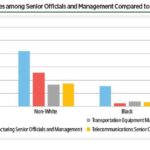
Representation of Women and Minorities among Senior Officials and Management Compared to Representation in U.S. Workforce, 2020
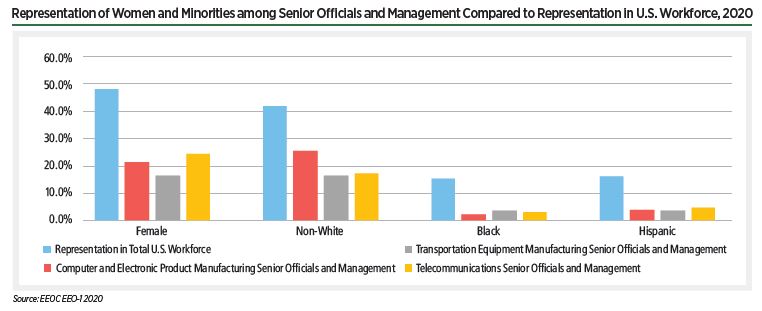
While all U.S. space companies with at least 100 employees (or at least 50 employees if they do work for the government) are required to collect information on diversity and report it to the U.S. government, most do not make this data available to the public.
Active Launch Vehicle Operators by Type, 2000-2022
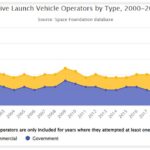
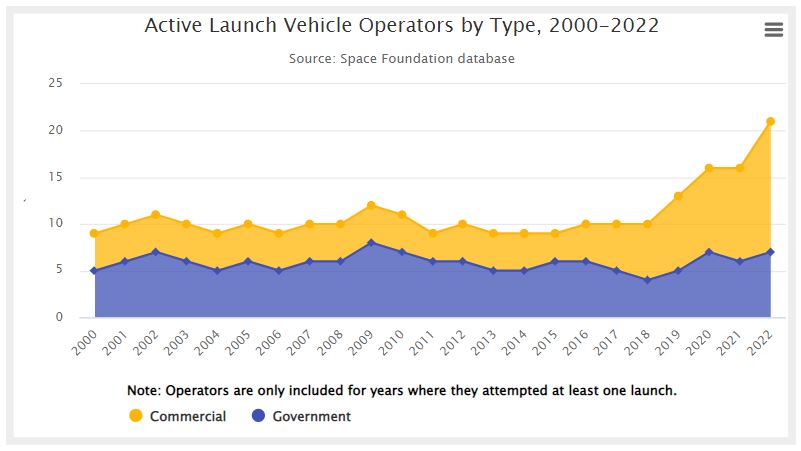
Orbital launch attempts have more than tripled since a lull in activity in the early 2000s bottomed out at 55 attempts in 2004. Part of the rapid growth in the past few years is due to a sharp increase in launch vehicle operators after a long period with an average just shy of 10 distinct operators per year.
NASA Civil Servant Workforce, FY 2013-2023
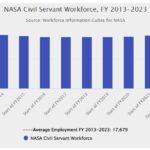
In 2022, NASA was named the best place to work in the federal government among large agencies for the 10th year in a row. NASA attributed this “decade of excellence” to the agency’s continuing dedication to supporting and strengthening its workforce.
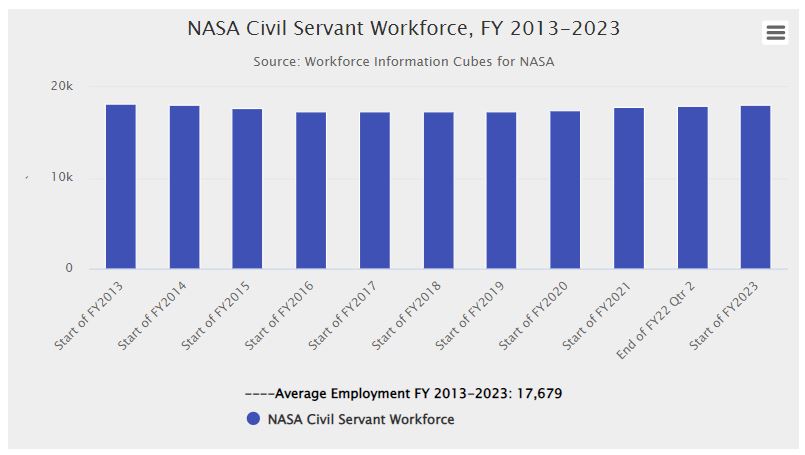
Representation of Women and Minorities in Selected Industries, 2020
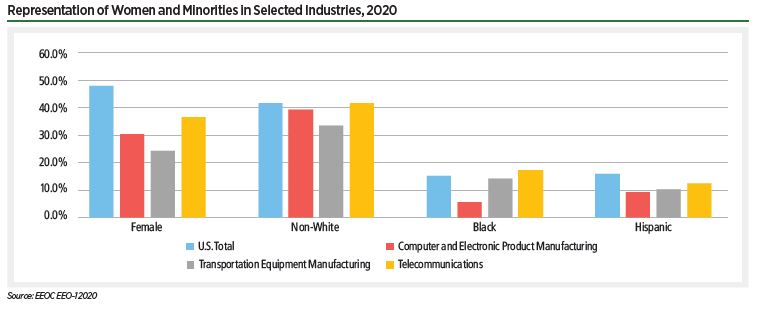
In the U.S. population as a whole, minorities (non-white individuals) make up nearly 42% of the workforce. Similar proportions of minorities are seen in Computer and Electronic Product Manufacturing and Telecommunications.
U.S. Space Industry Employment and U.S. Total Employment Relative to 2011
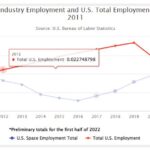
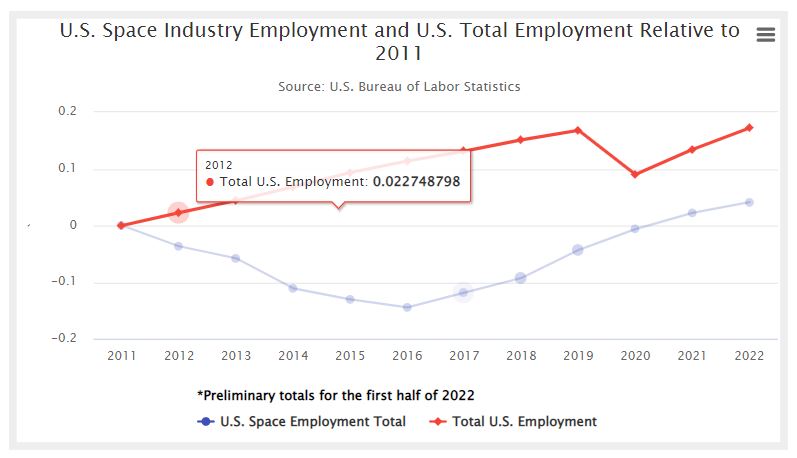
Employment at U.S. private sector space companies grew nearly 2% from 2021 to 2022, reaching 155,973 people in five employment classifications, based on preliminary estimates from the U.S. Bureau of Labor Statistics. This continues a consistent pattern of growth since 2016.
NASA Civil Servant Workforce Age Profiles over Time 1993-2023
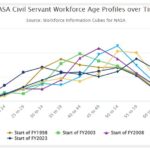
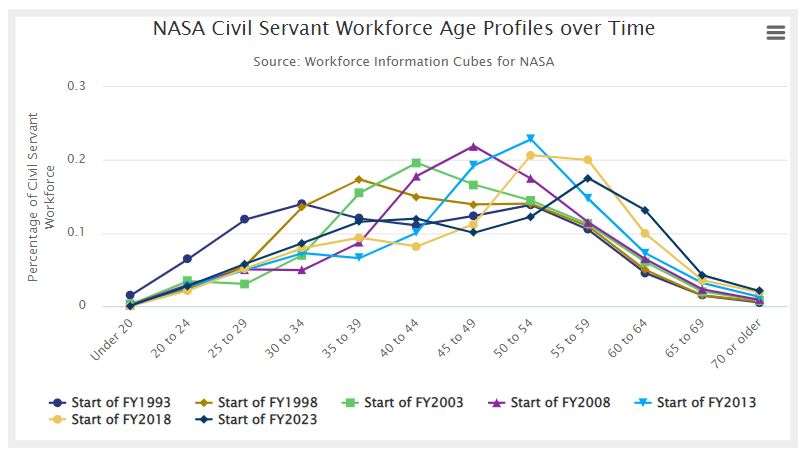
For many years, NASA has been working to manage the aging of its workforce. As of the beginning of FY 2023, 23% of the NASA workforce was eligible for retirement.