Interactive Tables and Charts
Data Workforce
Norway space workforce, 2009-2023
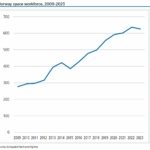
The Norwegian space industry is prioritizing initiatives to strengthen the domestic space workforce pipeline. Andøya Space’s subsidiary, Andøya Space Education, was established in 2000 to provide opportunities for students.
Space Force Guardians, 2020-2025
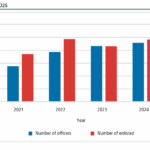
Space Force justified the bonuses as a tool to keep Guardians who could bolt for higher civilian salaries. The bonuses come with commitments of up to eight years in uniform, locking in Guardians for long stretches of service.
Military enlisted recruiting by percentage of goal attained, FY2021-2024


While some of its sister services struggle to meet recruiting demands to deter today’s enemies, the Space Force is peering far into the future.
India Department of Space workforce, 2013-2023
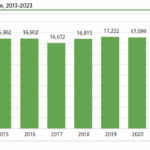
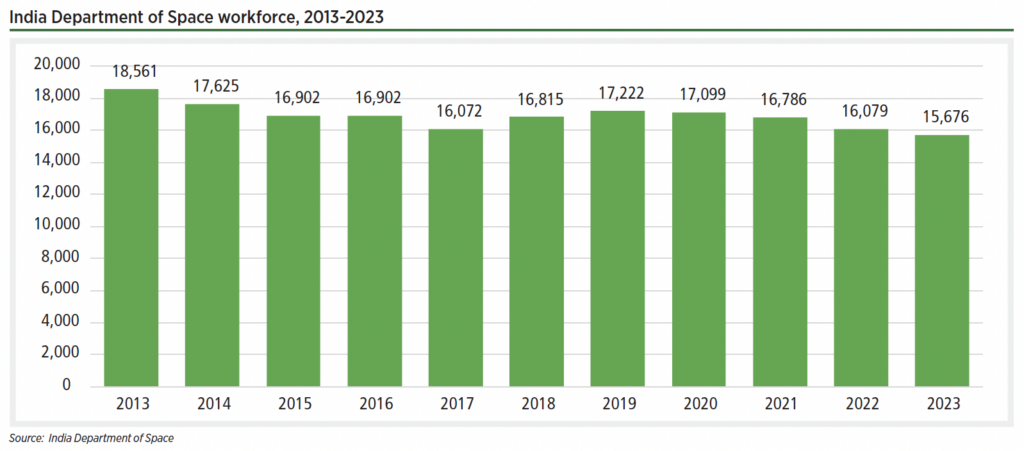
While ISRO remains an important player, a wave of new start-up companies has emerged. As of 2024, India was home to more than 400 private space companies.
JAXA workforce, 2014-2024
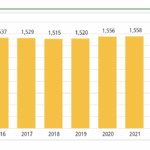
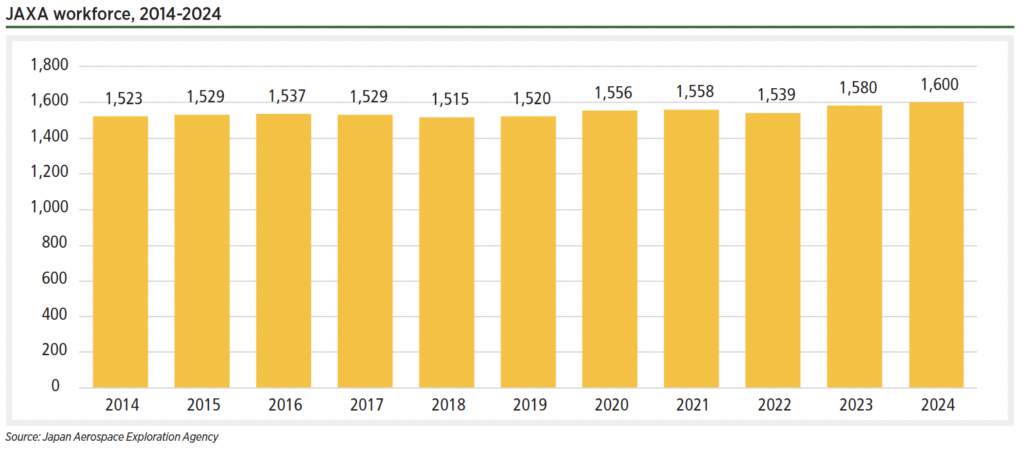
JAXA is also playing a growing role in encouraging broader growth of the Japanese space sector. In spring 2024, the Japanese cabinet approved a bill to establish a $6.7 billion that will allow JAXA to support development.
Japanese space industry workforce, 2012-2022
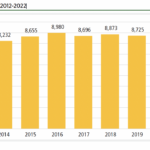
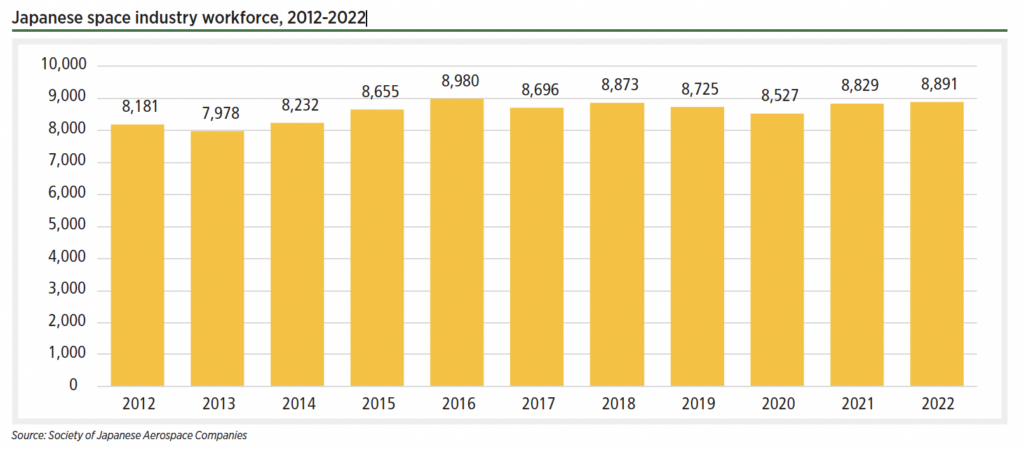
Annual statistics for the Japanese workforce are provided by the Society of Japanese Aerospace Companies. The Japanese space workforce has remained relatively stable over the past decade.
European space industry workforce, 2013-2023
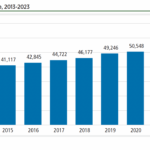
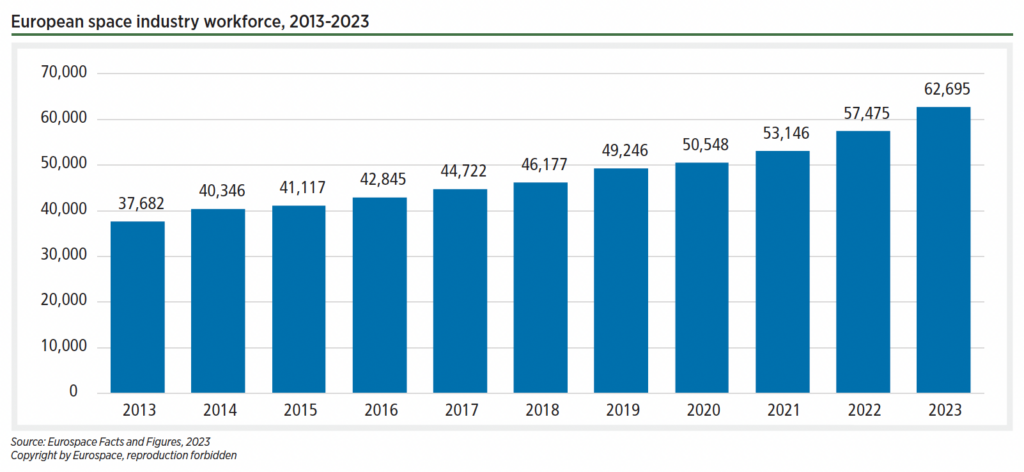
Eurospace collects workforce data through an annual survey of nearly 500 space organizations in Europe. The estimates include manufacturing of spacecraft, launchers, and ground segment components.
Space workforce trends in the United States, Europe, Japan, and India
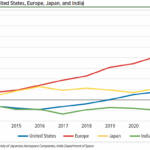
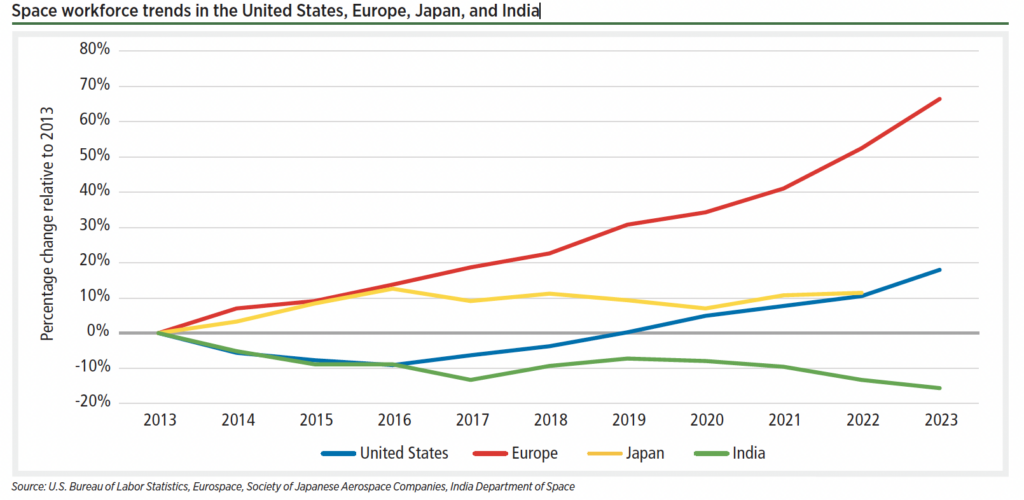
The United States and Europe saw significant growth in private sector space employment from 2022 to 2023, with increases of 6.7% and 9.1%, respectively.
NASA Civil Servant Workforce, FY 2013-2023
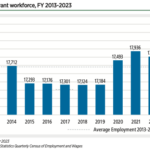
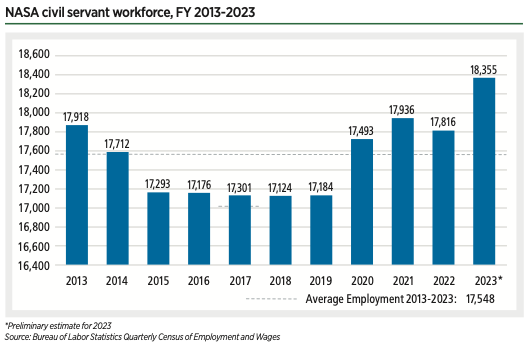
NASA employed approximately 18,372 employees in 2023. This is an increase of 3.1% over employment in 2022.
U.S. space private industry employment, 2012-2023
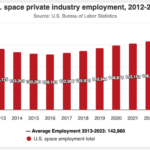
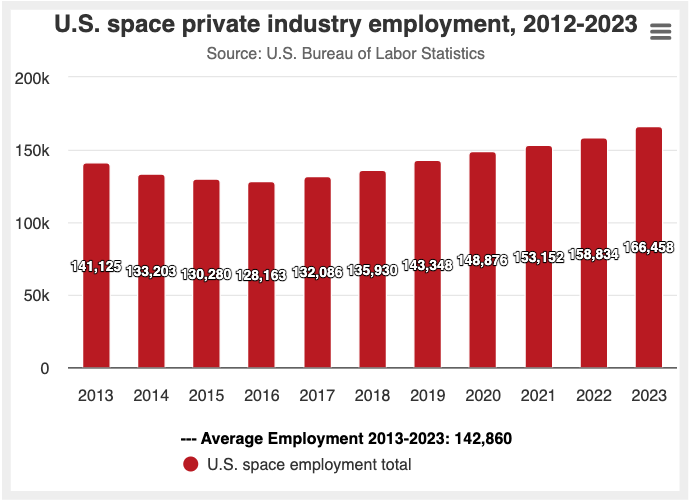
Some experts in the space sector worry that high inflation may put significant pressure on aerospace firms as the cost of materials increases rapidly.