2013
JAXA Workforce, 2012-2022
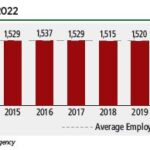
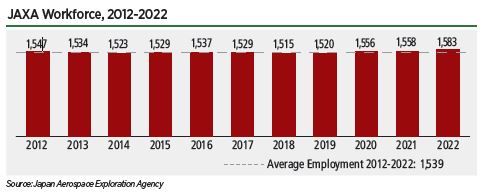
The Japan Aerospace Exploration Agency (JAXA) employed 1,583 people at the end of 2021, an increase of 1.6% from 1,558 employees at the end of 2020. Approximately 70% of JAXA employees work in engineering and research, with the remainder focused on education and administration. JAXA does not face the same demographic challenges as some other space agencies: 22.0% of its workforce is under 35 years old and 17.9% is over 54.
Japanese Space Industry Employment, 2010-2020
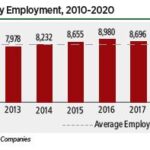
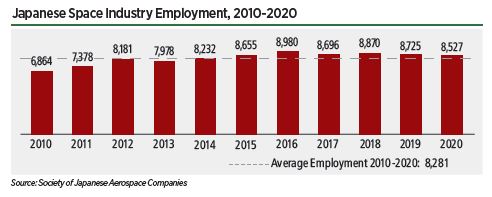
The Society of Japanese Aerospace Companies reports that the Japanese space sector employed 8,527 individuals in 2020, the most recent year for which data is available. This is a 2.3% decrease from the 2019 total of 8,725 employees. More than 70% of these employees work in the space vehicles sector, which includes launch vehicles, satellites, and the international space station. The remaining employees work on ground facilities and software relevant to space. Slight decreases in employment occurred across all portions of the space sector.
Space Insurance Industry Estimates, 2001-2021
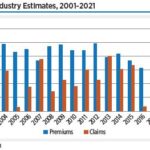
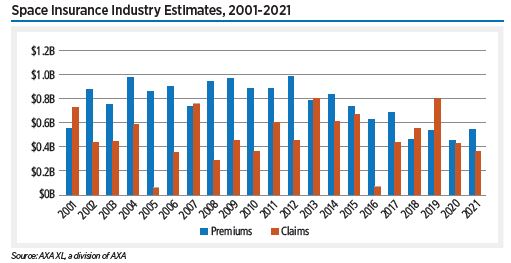
In 2021, despite high-profile insurance claims on numerous satellites. . . Net premiums totaled $537 million, and incurred losses were $362 million.
Launches in First Six Months of the Year, 1957-2022
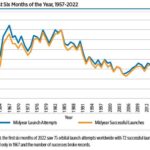
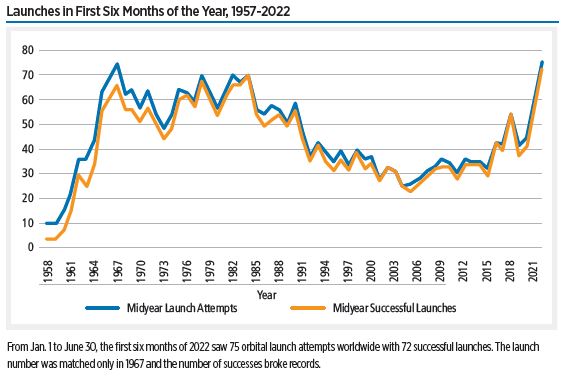
From Jan. 1 to June 30, the first six months of 2022 saw 75 orbital launch attempts worldwide with 72 successful launches. The launch number was matched only in 1967 and the number of successes broke records.
Global Space Activity by Category, 2005-2021
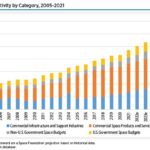
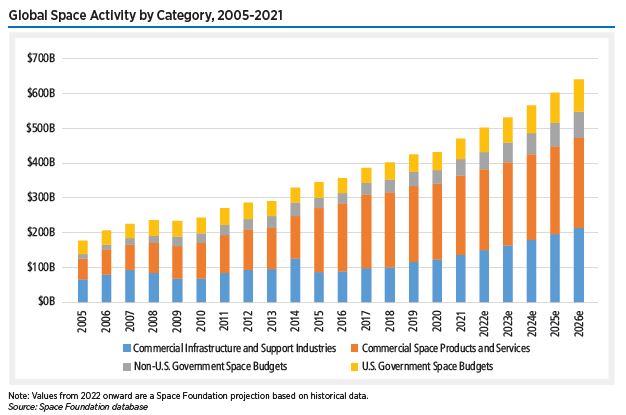
For this year’s analysis, Space Foundation incorporated historical data and 2022 government spending to project the global space economy’s growth over the next five years. Using our methodology, we predict that the total could reach $639 billion by 2026. Our modeling takes a more conservative approach based on average growth of established sectors and does not factor in developing sectors such as lunar habitation or still exploratory concepts such as asteroid mining.
European Space Industry Workforce by Sector 2003 – 2020
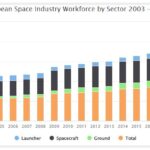
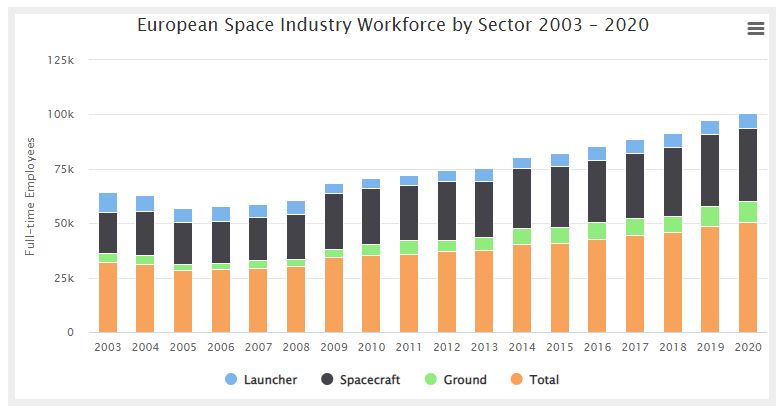
European space industry workforce by sector; launchers, spacecraft, and ground for 2003 through 2020.
U.S. Space Industry Employment and U.S. Total Employment Relative to 2010
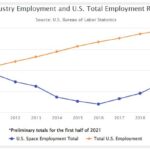
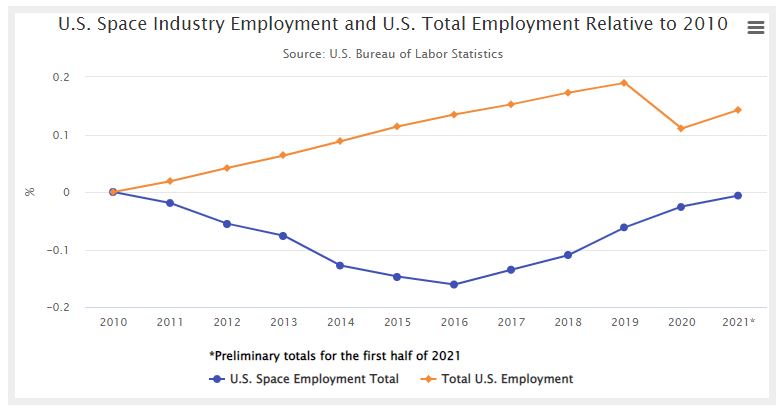
Estimates of the size of the U.S. space workforce are based on statistics made available in the U.S. Bureau of Labor Statistics (BLS) Quarterly Census of Employment and Wages. This program covers 95% of U.S. jobs and provides a consistent and reliable source of information to compare changes in the workforce over time.
Commercial Infrastructure and Support Industries, 2005-2020
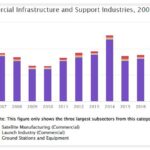
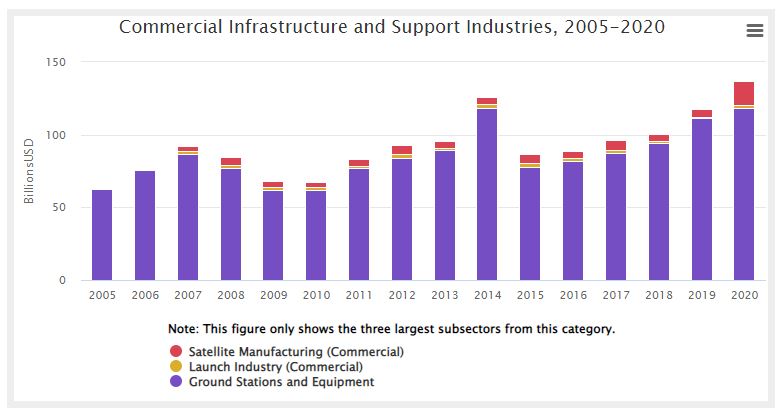
Commercial Infrastructure and Support Industries, 2005-2020 Specifically amounts in Billions of U.S. dollars for commercial satellite manufacturing, and launch industry, as well as ground stations and equipment.
NASA Civil Servant Workforce, 2012-2022
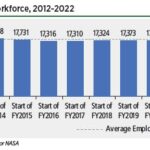
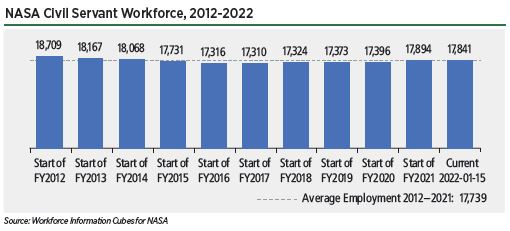
NASA’s civil service workforce has grown gradually in recent years, contributing to an increase in U.S. space employment.
U.S. Space Industry Core Employment, 2011-2021
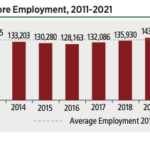
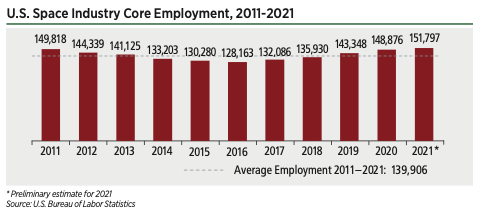
Core employment in 5 key space sectors continued to grow in 2021. These employment levels do not reflect all employment in the U.S. space industry, but rather, track employment in key sectors most closely associated with U.S. space employment.